Target Labels
How to define and generate target labels for supervised trading models, focusing on detecting sharp price moves using ATR-based thresholds.
Creating effective labels is a key part of building any supervised trading model. There are many possible approaches to defining these labels, and your choice should reflect how you plan to use the model's outputs.
In our case, we aim to detect sharp increases or decreases in price—moments that suggest a strong trading opportunity. Below, we explain the logic we used to label our dataset.
Labeling Logic
For each trading day in our dataset:
- We look ahead to the next 7 days.
- If there's a sharp decrease in price during that window, we label the current day as
1(Buy). - If there's a sharp increase, we label it as
-1(Sell). - If neither condition is met, we label it as
0(Hold).
This way, the model learns to anticipate sharp moves ahead of time—whether upward or downward.
What Defines a Sharp Move?
To define what qualifies as "sharp," we use the Average True Range (ATR). A price movement is considered sharp if:
The percentage change between today's close and any of the next 7 closes exceeds 1.5 × ATR.
Why ATR?
ATR captures the market's recent volatility. Using a fixed percentage would not adapt to different market conditions. ATR allows us to set a threshold that's responsive to the current level of price movement.
This makes the labeling process more robust and dynamic, especially across different assets or time periods.
Visual Example
Below is a chart showing how these target labels align with price movements:
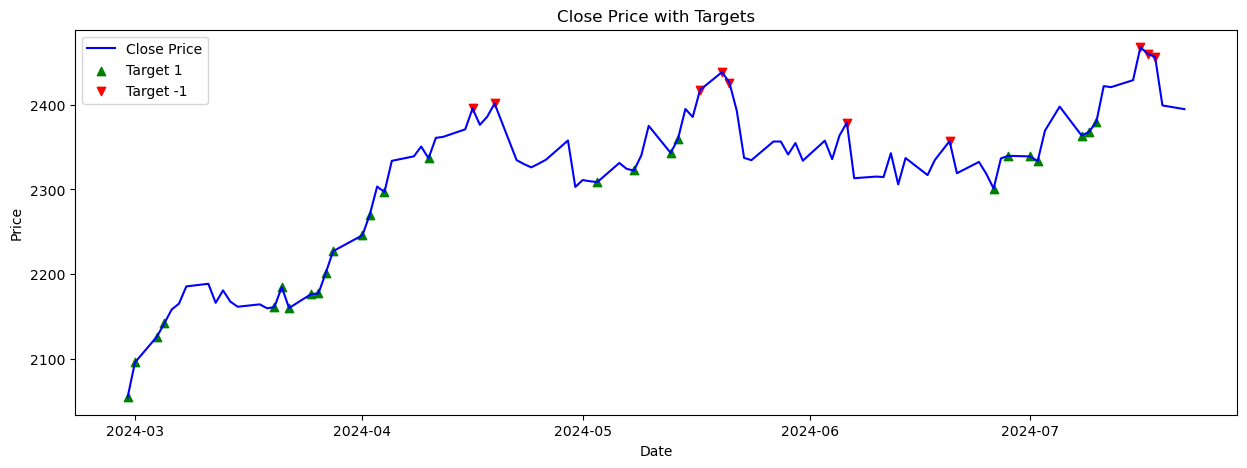
- Green triangles (▲) represent Buy signals (
1) - Red triangles (▼) represent Sell signals (
-1) - Days without markers are Hold (
0)
You can see how the labels correspond to local peaks and dips in the price action.
What Comes Next?
Once the data is labeled, the next step is preparing the features that help the model predict those labels. This includes adding indicators, generating input sequences, and training the model.
➡️ To continue, check out From Data to Signal where we walk through this process in detail(example).